
UK Fuel Price Index
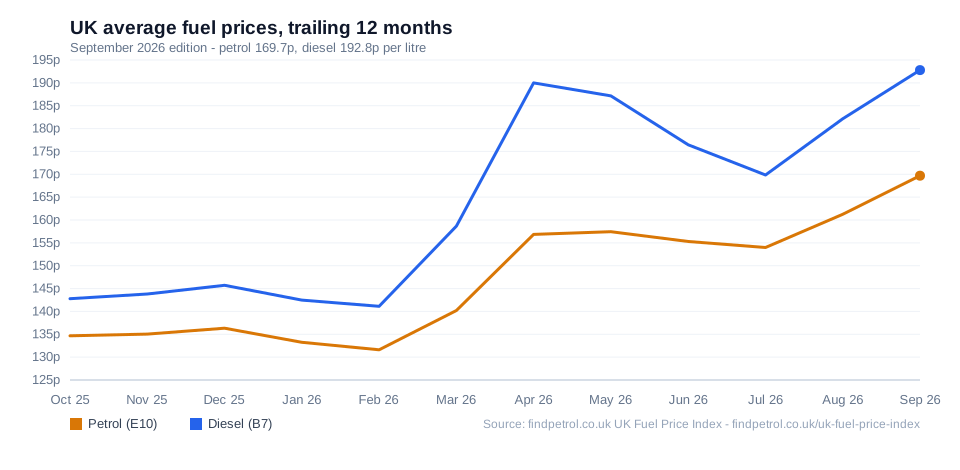
UK petrol and diesel monthly averages for September 2026, tracked nationally since January 2020. In September 2026, the UK average price of petrol was 169.7p per litre (▲ +8.4p vs August), with diesel at 192.8p per litre (▲ +10.7p).
- Based on prices collected since January 2020
- Every edition archived at its own URL
- Free to cite with attribution
Petrol, UK average
169.7p
▲ +8.4p month on month
▲ +35.7p year on year
Diesel, UK average
192.8p
▲ +10.7p month on month
▲ +51.0p year on year
Petrol, range in month
161.9p - 174.2p
petrol, 30 readings
Diesel, range in month
183.6p - 199.5p
diesel, 30 readings
Executive summary
The month's key figures in the form they are most often quoted. Each is free to cite with attribution; the full method is in the methodology.
In September 2026, the UK average price of petrol was 169.7p per litre (▲ +8.4p vs August), with diesel at 192.8p per litre (▲ +10.7p). Petrol ranged from 161.9p to 174.2p across UK stations during the month. Greater Belfast was the cheapest region (163.6p) and Highlands and Islands the most expensive (173.6p).
Against September 2025, petrol is up 35.7p a litre - about £19.64 more on a 55-litre fill.
Based on prices recorded since January 2020, petrol was cheapest in May 2020 at 106.2p per litre and most expensive in July 2022 at 189.4p. That's an 83.2p difference per litre, or about £45.75 for a 55 litre fill.
The gap between the cheapest and most expensive region is 10.0p a litre - about £5.50 on a 55-litre fill. Within a single town the gap is often wider still; compare stations near you.
Petrol and diesel over time
UK average pence per litre, one point per month. 81 months from January 2020.
Monthly data
| Fuel | Average | Low | High | Month on month |
|---|---|---|---|---|
| Petrol Unleaded (E10) | 169.7p | 161.9p | 174.2p | ▲ +8.4p |
| Diesel Standard (B7) | 192.8p | 183.6p | 199.5p | ▲ +10.7p |
Regional comparison
Averages by region for September 2026, the mean of 4 weekly snapshots taken during the month. We began recording regional figures in July 2026, so months before that are national only. Tap a region to see its own live prices page.
Fuel vs crude oil
Where the crude oil price goes, and how fast it reaches the pumps. About a third of the pump price is crude oil - the single biggest moving part - so we track the two together and measure how much of a crude move actually reaches the pump, and whether rises travel faster than falls.
This chart shows the last twelve months - the full history back to 2020 is on our fuel price trends page.
In September 2026, Brent crude averaged $114.16 a barrel, up 25.4% from August. The average petrol price was 169.7p a litre. Of that, about 53.6p reflected the cost of crude oil, 53.0p was fuel duty, 28.3p was VAT, and 34.9p covered refining, delivery and the retailer's share.
Do petrol prices rise faster than they fall when oil prices change? UK weekly data from October 2020 to November 2026 suggests they do. After weeks around fuel-duty changes are excluded, a 10% rise in crude oil prices was typically followed by a 3.7p increase in petrol prices within a month. A 10% fall, by contrast, was followed by a smaller drop of about 2.7p. In other words, pump prices tend to rise quickly when oil gets more expensive, but fall more slowly and by less when it gets cheaper.
This year, week by week, tells a similar story at a finer scale. UK data from January 2026 to October 2026 suggests a 10% rise in crude oil prices was typically followed by a 1.0p rise in petrol prices within a week, 1.7p within a fortnight and 2.1p within a month, with diesel moving faster still (about 2.1p within a week). A 10% fall, by contrast, was followed by a fall of about 0.4p within a month. That is 26 rising weeks of crude against 12 falling weeks - a small sample, so read it as a description of this year rather than a law of the market.
Brent crude fell 11.7% in the ten trading days to 3 November, from $117.37 to $103.60 a barrel. Based on how petrol prices have usually responded, that could mean a drop of around 3.2p a litre over the coming weeks. This is an estimate based on past patterns, not a forecast.
Crude converted at a stated $1.34 to the pound; duty is the 52.95p rate in force since March 2022; VAT is 20% of the final price. Full method and caveats in the data methodology. The complete analysis, charts and tables are in each month's September 2026 report (PDF).
Previous editions
Every edition keeps its own permanent URL, so a link to a particular month continues to show that month's figures.
Fuel price questions, answered
Straight answers to the questions drivers actually ask about pump prices - each one answered from this edition's own figures and six years of prices. Free to cite with attribution. Tap a question to open its answer.
How much of what I pay at the pump is tax?
About 81.2p of the 169.7p average pump price in September 2026: roughly 53.0p of fuel duty and 28.3p of VAT, or about 48% of every litre. The rest is the product itself and the cost of getting it to a station - about 53.6p of crude oil and 34.9p of refining, delivery and the retailer's share. Fuel duty has been frozen at 52.95p a litre since March 2022.
Do petrol prices rise faster than they fall when oil prices change?
Yes, the difference is clear. Our analysis of 313 weeks of UK data, from October 2020 to November 2026, suggests they do. A 10% rise in crude oil prices was typically followed by a 3.7p increase per litre at the pump within a month. A 10% fall brought a smaller drop of about 2.7p and took longer to come through.
Because pump prices rise more quickly and fall more slowly, repeated oil price swings can leave motorists paying more than they would if both changes were passed on equally. The chart and methodology are in the fuel vs crude oil section above, and the full history back to 2020 is on our fuel price trends page.
Are fuel retailers' margins unusually high?
We cannot see any retailer's books, so we will not quote a margin percentage. But the behaviour is visible in the prices. About 34.9p of this month's 169.7p average litre is everything between the refinery gate and the pump - refining, distribution and the retailer's own cut. Our figures show what happens to that slice: a 10% rise in crude reaches the pump quickly and in full (about 3.7p on a litre within a month), while a 10% fall arrives late and incomplete (about 2.7p off). Repeat that pattern through a few oil-price cycles and the slice can only drift one way: up. Concerns about exactly this pattern are why UK fuel retailers must now publish every price change within 30 minutes. In our view that transparency is welcome and overdue, and it is a large part of why this index exists.
What was the highest petrol price on record?
Going back to January 2020, the high is 189.4p a litre in July 2022 and the low is 106.2p in May 2020 - a swing of 83.2p a litre, or about £45.75 on a 55-litre fill. The record was set in the months after Russia's invasion of Ukraine, when crude spiked above $120 a barrel. The low came in the first national lockdown, when demand collapsed.
Why is fuel cheaper in some parts of the country?
Because pricing is local, and the gaps are bigger than most drivers expect. In September 2026 the cheapest region was Greater Belfast at 163.6p a litre and the most expensive was Highlands and Islands at 173.6p - a gap of 10.0p a litre, or about £5.50 on a 55-litre fill. The fuel, the duty and the VAT are identical everywhere; what differs is local competition, delivery costs and how many supermarket petrol stations are fighting for the trade - and within a single town the gap is often wider still. Every row in the table above links to that region's own live prices page, and you can compare all of them on our prices by region page.
Is now a good time to fill up?
Brent crude fell 11.7% over the ten trading days to 3 November. At the pace pump prices have historically followed oil, that points to petrol easing by around 3.2p a litre over the coming weeks - about £1.77 on a 55-litre fill. It is an estimate from past patterns, not a forecast, and it says nothing about your local station: compare live prices near you before you fill up.
Where does this data come from, and can I cite it?
From official sources: the Gov.uk weekly road fuel price statistics up to June 2026, and the CMA's open fuel price scheme (Fuel Finder) from July 2026 - the scheme under which retailers must report price changes within 30 minutes. The full method is on the methodology page, every monthly edition keeps its own permanent URL, and everything on this page is free to cite with attribution.
Methodology
Source. The monthly figures combine two official sources. Up to June 2026 it uses the Department for Energy Security and Net Zero weekly road fuel price statistics. From July 2026 it uses our own daily national average, calculated from prices retailers publish under the CMA open fuel price scheme.
Sampling, and why it changes. This matters if you are quoting the numbers. Months up to June 2026 are the mean of one official reading per week, so four or five readings a month. Months from July 2026 are the mean of one reading per day. This edition used 30 readings (daily sampling). Both are legitimate monthly means, but a month built from four Mondays is a coarser figure than one built from thirty-one days. Tested against July 2026, where both methods are available, the two approaches differ by 0.5p a litre - small, but not nothing, and worth a footnote if you are comparing a 2021 month against a 2026 one.
Coverage. The figures run from January 2020 to the present. Months with fewer than three readings are omitted entirely rather than published as a thin average.
Averaging. Figures are the unweighted mean of the price at each petrol station. A site is one observation regardless of how much fuel it sells, so this is an average of prices available, not of fuel purchased. Supermarket-heavy regions will read slightly lower than a volume-weighted measure.
Exclusions. Prices below 100p or above 300p a litre are excluded as data errors - a handful of sites report in pounds rather than pence. Records not updated within 30 days of the most recent feed update are excluded as stale.
Regions. Our regional figures begin in July 2026, because they come from our own weekly snapshots rather than the national statistics behind the rest of this data. This month has a regional breakdown, calculated as the mean of the 4 weekly snapshots taken during the month. Months with only one snapshot are not shown as a regional average, because a single reading describes a few days rather than the month.
Revisions. Completed months are settled and do not change. The current month is recalculated as new days arrive, so it should be treated as provisional until the month ends.
Using this data
These figures are free to use in articles, research and reporting. We ask only that you credit findpetrol and link back to this page, so readers can see the current edition and the method behind it.
Suggested citation
Underlying price data is published under the Open Government Licence v3.0. Download this edition as CSV.